The Statistics tool provides various statistical measures of selected source and display data. This tool is used by the Data Mapper tool to obtain pixel data distributions to appropriately locate Saturation Bounds when applying contrast stretches to the image display.
The Statistics Tool is a dockable tool with a Measurements Panel and a Histograms Panel. When the tool is located in a side dock area the Histograms Panel is not shown; this can result in a more compact application window when only using the Measurements Panel to provide statistics values reports.
The Statistics Tool is composed of two parts: a Source Data section and
a Display Data section. Tab buttons on the bottom of the tool are
provided to select the section of the tool to be used.
Source Data refers to the image data from the file at the
Source Location. The
statistics for the source data are based on the original image pixel
values.
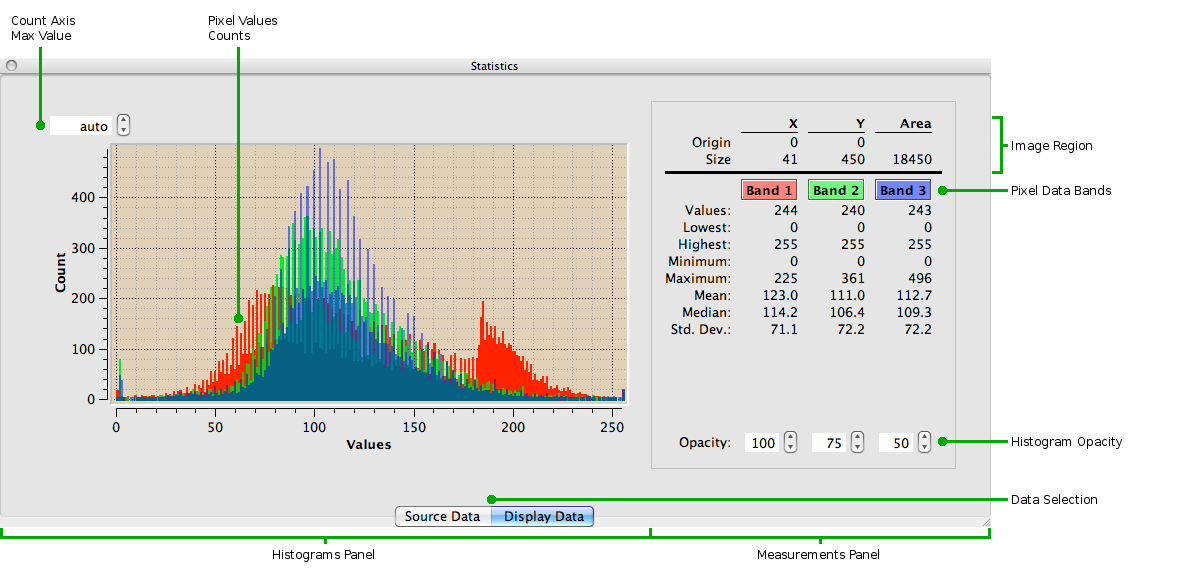
Display Data refers to the image as currently shown in the Main Image Viewport, taking into account any scrolling, scaling, alternate band mapping, and/or partially loaded image data. In other words, the Display Image is exactly the image displayed in the Main Image Viewport. The user may choose to think of the display image as the changeable visible image display and the source image as the unchanging data "underneath" the display
While Source Data may contain 0 to many bands of data, HiView's Display Data has three bands: red, green and blue (RGB). Source Data is mapped to Display Data using a lookup table (LUT), resulting in a displayable image. Therefore, while the Source Data panel may display 0 to many histograms - one histogram per band of data in the source image, the Display Data panel will always display 3 histograms - one for the display's red band, one for the green band, and one for the blue band.
The statistics that are provided are calculated from a selected image region of the Main Window Display Viewport. By default the entire image region in the viewport is used as the statistics Measurements Region. A more specific image region may be selected by clicking and dragging the cursor over the region of interest. The cursor will change to a diagonal Resize Region cursor image while the corner of the image region is being dragged. The selected region will be outlined and highlighted as an overlay of the image display. The selected region may be resized after the selection has been made by clicking and dragging the edges or corners of the selection rectangle. The cursor will change to the corresponding Resize Region cursor when it is over a selection edge or corner. The selected region may be moved to a new location by clicking and dragging the cursor anywhere inside the selected region. The cursor will change to a Shift Region cursor image when it is over the selected region. To revert to using the entire image region in the viewport as the Measurements Region double-click anywhere inside the displayed image region.
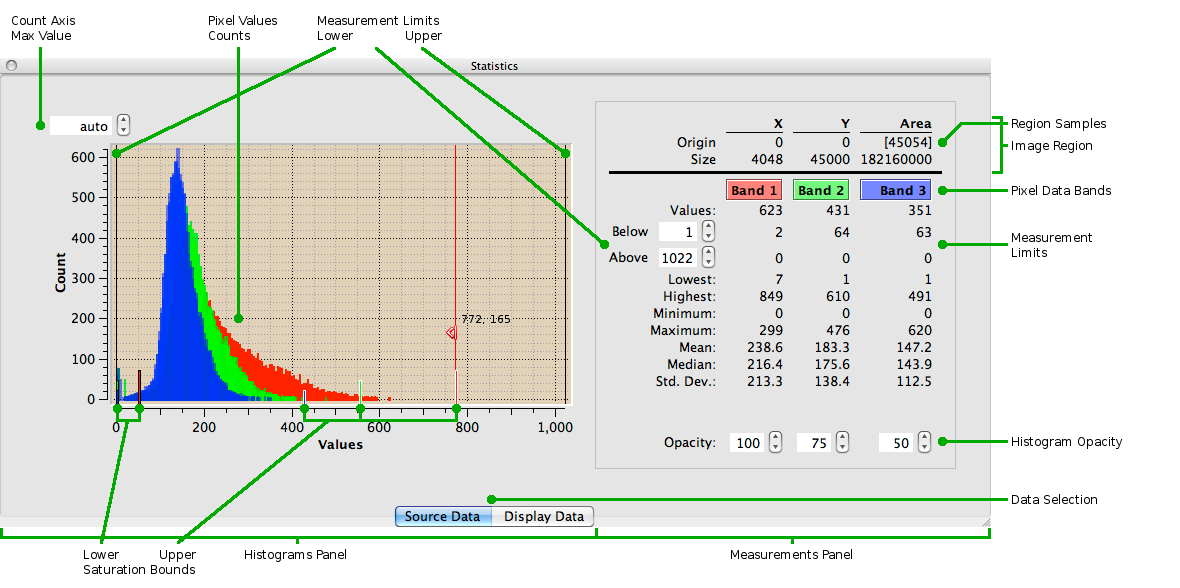
The location and size of the statistics image Measurements Region is reported at the top of the Measurements Panel.
When the statistics Measurements Region is based on low resolution image samples the Area of the actual sample region is listed inside brackets in the Origin row; i.e. this is the actual origin of the measurements.
The Measurements panel lists a set of statistical information calculated from the Measurements Region. The values are reported for each source data band mapped to a display band. The Band column labels for the Source Data Measurements panel indicate which source data band is measured. For monochrome source data there is only one band of data and so there will be only one Band column of statistics measurements.
Most of the same measurements are reported for the Source Data and
Display Data. Exceptions are noted.
These measures are only relevant for Source Data.
For Source Data these values will be within the valid data
Limits.
For Source Data those Values outside the valid data
Limits are excluded.
For Source Data those pixel values outside the valid data
Limits are excluded from the calculation.
For Source Data touse pixel values outside the valid data
Limits are excluded from the calculation.
For Source Data pixel values outside the valid data are
excluded from the calculation.
The Source Data section adds two rows to the Measurements Panel concerned
with the limits of valid data in the image. Scientific image data is
often extensively processed in an effort to compensate for photometric
(pixel values) and geometric (image structure) inaccuracies produced by
the imaging instrument and/or the observing conditions when the image
data was obtained. The results of the image processing algorithms can
produce pixel values that are known to be invalid for some reason. For
example, when geometrically adjusting the image to provide a spatially
aligned data set from an oblique view of a surface area some parts of
the new image rectangle may not fall within the area of the original
image resulting in invalid background pixel values. Or photometric
processing calibration of the pixel values may result in some values
that are too high for the available data precision of the resulting
image. Invalid pixel values are usually reserved at the extreme range
of the possible values; perhaps one or two of the lowest pixel values
and a couple of the highest pixel values are used to give to pixels
that turn out to have invalid values during image processing. Invalid
pixel values should be excluded from statistical measures that are
meant to apply to valid image data.
The Below and Above Limits are marked on the Histogram Graph as black vertical lines at the corresponding Values locations. The Measurements Panel lists the total number of pixels with values Below and Above the Limits.
Note: When the Limits are moved the Saturation Bounds are forced to remain within the Limits.
The histogram plots are colored according to the display band with which
they are associated. The height of a bar on the histogram is the Count
of pixels with the corresponding Values in the Measurements Region. When
the cursor is over the histogram plot canvas it appears as a small
crosshair image with its position in the plot - as a Values, Count
coordinate - listed next to the cursor. The maximum value of the Values
axis is the maximum pixel
value.
The maximum
value of the Count axis is automatically adjusted as the Measurements
Region changes if the field about the Count axis says "auto". The value
in this field may be set to a specific value to fix the maximum value
of the Count axis, and returned to automatic tracking by entering a
value of zero.
At the bottom of the Measurements panel are Opacity controls for
each band plot of the Histogram. The Opacity value controls how
transparent the band plot will be in allowing plots for other bands
underneath to show through. An Opacity of 100 has no transparency
- i.e. it is 100 percent opaque - and will completely obscure any
underlying band plot. Histogram bands are plotted with the red band
on top of the green band which is on top of the blue band.
Marked on the Source Data Histograms plots are the Saturation Bounds Values for each mapped source band. The marks are short vertical bars of staggered height at the bottom of the plot canvas at the bound's Values location, colored the same as their band and outlined in black for Lower Bounds and white for Upper Bounds.

