The Navigator tool provides image navigation controls and information. It is a dockable tool that can be located in the left or right side dock areas, or detached as a separate floating window.
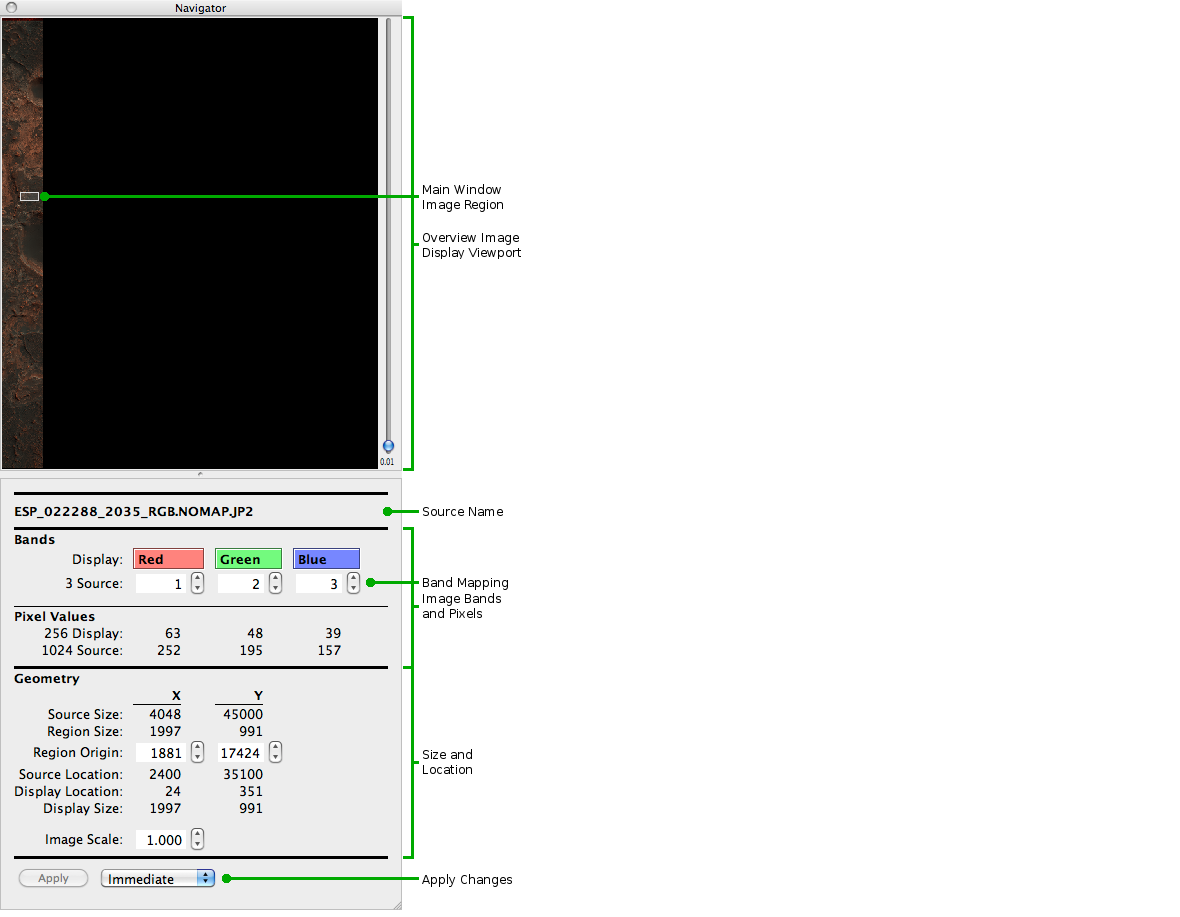
The Overview Image panel contains a display of the currently loaded image. The image is initially scaled down as much as possible to fit in the area of the panel. If the image is very large in either dimension compared to the panel size the entire image may not fit in panel area even at the smallest scaling factor. In this case scroll bars will appear around the panel area. An image scaling slider is always visible to the right side of the panel area; this can be used to resize the overview image.
The amount of vertical space available to the Overview Image panel relative to the Image Details panel below it may be adjusted by moving the separator between the two panels. The presence of the separator is indicated by the cursor changing to a horizontal bar with a double-headed vertical arrow. Drag the separator to a new vertical position in the Navigator Tool to adjust the relative size of the two panels.
The Overview Image panel functions the same as the Main Window image display viewport: When the Navigator has the application focus (click in it to give it the focus) all of the same scrolling and scaling controls will apply to the Overview Image; it also has the same pop-up menu with Scale Image items.
The user may use the thumbnail image to navigate to a different region
of the image by clicking and dragging the shaded region on the
thumbnail image, or by double-clicking anywhere on the thumbnail image.
Wherever the user moves the shaded region, the display in the Main
Image Viewport will automatically scroll to that area.
Below the Overview Image panel is a panel providing details about the image and what is currently being displayed. This information is intended to completely describe the image and its display state. Some of the information is static and, for any given image, does not change; other information is dynamically changed by HiView, as the image display is manipulated, to reflect the current state of the image display. Some of the information is purely informative; however, in some cases a value may be directly changed to change the corresponding image display state.
If the brief image information in the Main Window Image Info panel is sufficient and the Image Details panel is taking up too much space in a dock area also occupied by the Data Mapper Tool but the presence of the Overview Image is still desired, the Image Details panel can be closed by dragging the separator between the two panels down over about half of the lower panel. To open the Image Details panel again drag the separator, now located at the bottom of the Navigator Tool, back up over about half of the Overview Image panel. Note that the Overview Image panel may be closed and opened in the same way.
HiView works with image data sets composed of one or more bands - or
layers - of image data. A band is conceptually a matrix - a rectangular
grid, or "raster" - of individual data numbers (DN or samples) for each
location in the band.
Typically the source data has three bands that are each mapped to the expected Display band so the Display image is perceived to be the same as the Source image. For scientific image data, however, there may be many bands of data in an image, where, for example, each band provides the DNs for a certain wavelength range (generally indicated by the center value of the range) that was sensed during the observation of the instrument gathering the image data. In cases like this, exploring the data involves mapping various Source bands to the Display bands.
Any Source data band may be mapped to any Display data band. Some Source data bands may not be mapped to any Display data band. This is always the case for a source image with more than three bands, but may also occur when the source image has two or three bands. Some Source data bands may be mapped to more than one Display data band. This is always the case for a source image with less than three bands - for example, a single band (monochrome) source image will always have its band mapped to all three Display bands - but may be done in other cases - for example, if a single band of source data with multiple bands is to be visually explored the selected band can be mapped to all three Display bands. By default source data bands, starting with the first band, are mapped in increasing order to the Red, Green, and Blue Display data bands. If there are less than three source data bands the last available band is mapped to the remaining Display bands.
When a band mapping value is changed, the Display Viewport images are immediately redisplayed with the new mapping. Changing the band mapping causes a Restore Value button - a circular green arrow icon - to appear to the right of the Source band mapping fields. Clicking this button will restore the band mapping to its initial state.
Each pixel
in the displayed image has a data value, sometimes called a pixel sample,
for each Display band that
has been data mapped from a Source pixel
composed of the values from the source data Band that has been
band mapped to the corresponding display band.
The values reported are for the pixel at the cursor location. If the
cursor is not located over the image region in the
Main Window Display Viewport
or the Overview Image Display Viewport
no values will be listed.
Image geometry is reported for the region of the image in the Main Window Image Display Viewport, and the Source image on which it is based.
X and Y position coordinates have their origin - i.e. are relative to
pixel 0, 0 - at the upper-left corner of the region or image. Coordinate
values increase to the right (positive X direction) and downward
(positive Y direction). This is called a
left-handed coordinate system, which is the norm for
raster scan
organized image data.
The Apply Changes button has two settings: Immediate and Deferred.
The Immediate or Deferred Mode is "sticky"; i.e. it is saved in the user's HiView configuration file along with the Preferences settings to be restored each time HiView is run.