org.jfree.chart.renderer.category
Class StackedBarRenderer3D
java.lang.Object
  org.jfree.chart.renderer.AbstractRenderer
      org.jfree.chart.renderer.category.AbstractCategoryItemRenderer
          org.jfree.chart.renderer.category.BarRenderer
              org.jfree.chart.renderer.category.BarRenderer3D
                  org.jfree.chart.renderer.category.StackedBarRenderer3D
org.jfree.chart.renderer.AbstractRenderer
org.jfree.chart.renderer.category.AbstractCategoryItemRenderer
org.jfree.chart.renderer.category.BarRenderer
org.jfree.chart.renderer.category.BarRenderer3D
org.jfree.chart.renderer.category.StackedBarRenderer3D
- All Implemented Interfaces:
- java.io.Serializable, java.lang.Cloneable, Effect3D, LegendItemSource, CategoryItemRenderer, org.jfree.util.PublicCloneable
public class StackedBarRenderer3D
- extends BarRenderer3D
- implements java.lang.Cloneable, org.jfree.util.PublicCloneable, java.io.Serializable
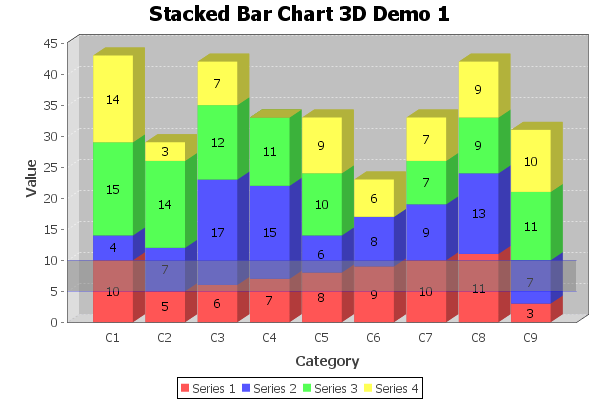
Renders stacked bars with 3D-effect, for use with the CategoryPlot
class. The example shown here is generated by the
StackedBarChart3DDemo1.java program included in the
JFreeChart Demo Collection:
- See Also:
- Serialized Form
|
Constructor Summary |
StackedBarRenderer3D()
Creates a new renderer with no tool tip generator and no URL generator. |
StackedBarRenderer3D(boolean renderAsPercentages)
Creates a new renderer. |
StackedBarRenderer3D(double xOffset,
                                         double yOffset)
Constructs a new renderer with the specified '3D effect'. |
StackedBarRenderer3D(double xOffset,
                                         double yOffset,
                                         boolean renderAsPercentages)
Constructs a new renderer with the specified '3D effect'. |
|
Method Summary |
protected void |
calculateBarWidth(CategoryPlot plot,
                                   java.awt.geom.Rectangle2D dataArea,
                                   int rendererIndex,
                                   CategoryItemRendererState state)
Calculates the bar width and stores it in the renderer state. |
protected static java.util.List |
createStackedValueList(CategoryDataset dataset,
                                             java.lang.Comparable category,
                                             double base,
                                             boolean asPercentages)
Deprecated. As of 1.0.13, use createStackedValueList(
CategoryDataset, Comparable, int[], double, boolean). |
protected static java.util.List |
createStackedValueList(CategoryDataset dataset,
java.lang.Comparable category,
int[] includedRows,
double base,
boolean asPercentages)
Returns a list containing the stacked values for the specified series
in the given dataset, plus the supplied base value. |
void |
drawItem(java.awt.Graphics2D g2,
CategoryItemRendererState state,
java.awt.geom.Rectangle2D dataArea,
CategoryPlot plot,
CategoryAxis domainAxis,
ValueAxis rangeAxis,
CategoryDataset dataset,
int row,
int column,
int pass)
Draws the visual representation of one data item from the chart (in
fact, this method does nothing until it reaches the last item for each
category, at which point it draws all the items for that category). |
protected void |
drawStackHorizontal(java.util.List values,
java.lang.Comparable category,
java.awt.Graphics2D g2,
CategoryItemRendererState state,
java.awt.geom.Rectangle2D dataArea,
CategoryPlot plot,
CategoryAxis domainAxis,
ValueAxis rangeAxis,
CategoryDataset dataset)
Draws a stack of bars for one category, with a horizontal orientation. |
protected void |
drawStackVertical(java.util.List values,
java.lang.Comparable category,
java.awt.Graphics2D g2,
CategoryItemRendererState state,
java.awt.geom.Rectangle2D dataArea,
CategoryPlot plot,
CategoryAxis domainAxis,
ValueAxis rangeAxis,
CategoryDataset dataset)
Draws a stack of bars for one category, with a vertical orientation. |
boolean |
equals(java.lang.Object obj)
Tests this renderer for equality with an arbitrary object. |
Range |
findRangeBounds(CategoryDataset dataset)
Returns the range of values the renderer requires to display all the
items from the specified dataset. |
boolean |
getRenderAsPercentages()
Returns true if the renderer displays each item value as
a percentage (so that the stacked bars add to 100%), and
false otherwise. |
void |
setRenderAsPercentages(boolean asPercentages)
Sets the flag that controls whether the renderer displays each item
value as a percentage (so that the stacked bars add to 100%), and sends
a RendererChangeEvent to all registered listeners. |
| Methods inherited from class org.jfree.chart.renderer.category.BarRenderer3D |
drawBackground, drawDomainGridline, drawOutline, drawRangeGridline, drawRangeLine, drawRangeMarker, getWallPaint, getXOffset, getYOffset, initialise, setWallPaint |
| Methods inherited from class org.jfree.chart.renderer.category.BarRenderer |
calculateBarL0L1, calculateBarW0, calculateSeriesWidth, drawItemLabel, getBarPainter, getBase, getDefaultBarPainter, getDefaultShadowsVisible, getGradientPaintTransformer, getIncludeBaseInRange, getItemMargin, getLegendItem, getLowerClip, getMaximumBarWidth, getMinimumBarLength, getNegativeItemLabelPositionFallback, getPositiveItemLabelPositionFallback, getShadowPaint, getShadowsVisible, getShadowXOffset, getShadowYOffset, getUpperClip, isDrawBarOutline, setBarPainter, setBase, setDefaultBarPainter, setDefaultShadowsVisible, setDrawBarOutline, setGradientPaintTransformer, setIncludeBaseInRange, setItemMargin, setMaximumBarWidth, setMinimumBarLength, setNegativeItemLabelPositionFallback, setPositiveItemLabelPositionFallback, setShadowPaint, setShadowVisible, setShadowXOffset, setShadowYOffset |
| Methods inherited from class org.jfree.chart.renderer.category.AbstractCategoryItemRenderer |
addEntity, addItemEntity, calculateDomainMarkerTextAnchorPoint, calculateRangeMarkerTextAnchorPoint, clone, createState, drawDomainMarker, drawItemLabel, findRangeBounds, getBaseItemLabelGenerator, getBaseItemURLGenerator, getBaseToolTipGenerator, getColumnCount, getDomainAxis, getDrawingSupplier, getItemLabelGenerator, getItemMiddle, getItemURLGenerator, getLegendItemLabelGenerator, getLegendItems, getLegendItemToolTipGenerator, getLegendItemURLGenerator, getPassCount, getPlot, getRangeAxis, getRowCount, getSeriesItemLabelGenerator, getSeriesItemURLGenerator, getSeriesToolTipGenerator, getToolTipGenerator, getToolTipGenerator, hashCode, setBaseItemLabelGenerator, setBaseItemURLGenerator, setBaseToolTipGenerator, setItemLabelGenerator, setItemURLGenerator, setLegendItemLabelGenerator, setLegendItemToolTipGenerator, setLegendItemURLGenerator, setPlot, setSeriesItemLabelGenerator, setSeriesItemURLGenerator, setSeriesToolTipGenerator, setToolTipGenerator, updateCrosshairValues |
| Methods inherited from class org.jfree.chart.renderer.AbstractRenderer |
addChangeListener, calculateLabelAnchorPoint, clearSeriesPaints, clearSeriesStrokes, fireChangeEvent, getAutoPopulateSeriesFillPaint, getAutoPopulateSeriesOutlinePaint, getAutoPopulateSeriesOutlineStroke, getAutoPopulateSeriesPaint, getAutoPopulateSeriesShape, getAutoPopulateSeriesStroke, getBaseCreateEntities, getBaseFillPaint, getBaseItemLabelFont, getBaseItemLabelPaint, getBaseItemLabelsVisible, getBaseLegendShape, getBaseLegendTextFont, getBaseLegendTextPaint, getBaseNegativeItemLabelPosition, getBaseOutlinePaint, getBaseOutlineStroke, getBasePaint, getBasePositiveItemLabelPosition, getBaseSeriesVisible, getBaseSeriesVisibleInLegend, getBaseShape, getBaseStroke, getCreateEntities, getDataBoundsIncludesVisibleSeriesOnly, getDefaultEntityRadius, getItemCreateEntity, getItemFillPaint, getItemLabelAnchorOffset, getItemLabelFont, getItemLabelFont, getItemLabelPaint, getItemLabelPaint, getItemOutlinePaint, getItemOutlineStroke, getItemPaint, getItemShape, getItemStroke, getItemVisible, getLegendShape, getLegendTextFont, getLegendTextPaint, getNegativeItemLabelPosition, getNegativeItemLabelPosition, getPositiveItemLabelPosition, getPositiveItemLabelPosition, getSeriesCreateEntities, getSeriesFillPaint, getSeriesItemLabelFont, getSeriesItemLabelPaint, getSeriesNegativeItemLabelPosition, getSeriesOutlinePaint, getSeriesOutlineStroke, getSeriesPaint, getSeriesPositiveItemLabelPosition, getSeriesShape, getSeriesStroke, getSeriesVisible, getSeriesVisible, getSeriesVisibleInLegend, getSeriesVisibleInLegend, hasListener, isItemLabelVisible, isSeriesItemLabelsVisible, isSeriesVisible, isSeriesVisibleInLegend, lookupLegendShape, lookupLegendTextFont, lookupLegendTextPaint, lookupSeriesFillPaint, lookupSeriesOutlinePaint, lookupSeriesOutlineStroke, lookupSeriesPaint, lookupSeriesShape, lookupSeriesStroke, notifyListeners, removeChangeListener, setAutoPopulateSeriesFillPaint, setAutoPopulateSeriesOutlinePaint, setAutoPopulateSeriesOutlineStroke, setAutoPopulateSeriesPaint, setAutoPopulateSeriesShape, setAutoPopulateSeriesStroke, setBaseCreateEntities, setBaseCreateEntities, setBaseFillPaint, setBaseFillPaint, setBaseItemLabelFont, setBaseItemLabelFont, setBaseItemLabelPaint, setBaseItemLabelPaint, setBaseItemLabelsVisible, setBaseItemLabelsVisible, setBaseItemLabelsVisible, setBaseLegendShape, setBaseLegendTextFont, setBaseLegendTextPaint, setBaseNegativeItemLabelPosition, setBaseNegativeItemLabelPosition, setBaseOutlinePaint, setBaseOutlinePaint, setBaseOutlineStroke, setBaseOutlineStroke, setBasePaint, setBasePaint, setBasePositiveItemLabelPosition, setBasePositiveItemLabelPosition, setBaseSeriesVisible, setBaseSeriesVisible, setBaseSeriesVisibleInLegend, setBaseSeriesVisibleInLegend, setBaseShape, setBaseShape, setBaseStroke, setBaseStroke, setCreateEntities, setCreateEntities, setDataBoundsIncludesVisibleSeriesOnly, setDefaultEntityRadius, setFillPaint, setFillPaint, setItemLabelAnchorOffset, setItemLabelFont, setItemLabelFont, setItemLabelPaint, setItemLabelPaint, setItemLabelsVisible, setItemLabelsVisible, setItemLabelsVisible, setLegendShape, setLegendTextFont, setLegendTextPaint, setNegativeItemLabelPosition, setNegativeItemLabelPosition, setOutlinePaint, setOutlinePaint, setOutlineStroke, setOutlineStroke, setPaint, setPaint, setPositiveItemLabelPosition, setPositiveItemLabelPosition, setSeriesCreateEntities, setSeriesCreateEntities, setSeriesFillPaint, setSeriesFillPaint, setSeriesItemLabelFont, setSeriesItemLabelFont, setSeriesItemLabelPaint, setSeriesItemLabelPaint, setSeriesItemLabelsVisible, setSeriesItemLabelsVisible, setSeriesItemLabelsVisible, setSeriesNegativeItemLabelPosition, setSeriesNegativeItemLabelPosition, setSeriesOutlinePaint, setSeriesOutlinePaint, setSeriesOutlineStroke, setSeriesOutlineStroke, setSeriesPaint, setSeriesPaint, setSeriesPositiveItemLabelPosition, setSeriesPositiveItemLabelPosition, setSeriesShape, setSeriesShape, setSeriesStroke, setSeriesStroke, setSeriesVisible, setSeriesVisible, setSeriesVisible, setSeriesVisible, setSeriesVisibleInLegend, setSeriesVisibleInLegend, setSeriesVisibleInLegend, setSeriesVisibleInLegend, setShape, setShape, setStroke, setStroke |
| Methods inherited from class java.lang.Object |
finalize, getClass, notify, notifyAll, toString, wait, wait, wait |
| Methods inherited from interface org.jfree.util.PublicCloneable |
clone |
| Methods inherited from interface org.jfree.chart.renderer.category.CategoryItemRenderer |
addChangeListener, getBaseItemLabelFont, getBaseItemLabelPaint, getBaseItemLabelsVisible, getBaseNegativeItemLabelPosition, getBaseOutlinePaint, getBaseOutlineStroke, getBasePaint, getBasePositiveItemLabelPosition, getBaseSeriesVisible, getBaseSeriesVisibleInLegend, getBaseShape, getBaseStroke, getItemLabelFont, getItemLabelFont, getItemLabelPaint, getItemLabelPaint, getItemOutlinePaint, getItemOutlineStroke, getItemPaint, getItemShape, getItemStroke, getItemVisible, getNegativeItemLabelPosition, getNegativeItemLabelPosition, getPositiveItemLabelPosition, getPositiveItemLabelPosition, getSeriesItemLabelFont, getSeriesItemLabelPaint, getSeriesNegativeItemLabelPosition, getSeriesOutlinePaint, getSeriesOutlineStroke, getSeriesPaint, getSeriesPositiveItemLabelPosition, getSeriesShape, getSeriesStroke, getSeriesVisible, getSeriesVisible, getSeriesVisibleInLegend, getSeriesVisibleInLegend, isItemLabelVisible, isSeriesItemLabelsVisible, isSeriesVisible, isSeriesVisibleInLegend, removeChangeListener, setBaseItemLabelFont, setBaseItemLabelPaint, setBaseItemLabelsVisible, setBaseItemLabelsVisible, setBaseItemLabelsVisible, setBaseNegativeItemLabelPosition, setBaseNegativeItemLabelPosition, setBaseOutlinePaint, setBaseOutlineStroke, setBasePaint, setBasePositiveItemLabelPosition, setBasePositiveItemLabelPosition, setBaseSeriesVisible, setBaseSeriesVisible, setBaseSeriesVisibleInLegend, setBaseSeriesVisibleInLegend, setBaseShape, setBaseStroke, setItemLabelFont, setItemLabelPaint, setItemLabelsVisible, setItemLabelsVisible, setItemLabelsVisible, setNegativeItemLabelPosition, setNegativeItemLabelPosition, setOutlinePaint, setOutlineStroke, setPaint, setPositiveItemLabelPosition, setPositiveItemLabelPosition, setSeriesItemLabelFont, setSeriesItemLabelPaint, setSeriesItemLabelsVisible, setSeriesItemLabelsVisible, setSeriesItemLabelsVisible, setSeriesNegativeItemLabelPosition, setSeriesNegativeItemLabelPosition, setSeriesOutlinePaint, setSeriesOutlineStroke, setSeriesPaint, setSeriesPositiveItemLabelPosition, setSeriesPositiveItemLabelPosition, setSeriesShape, setSeriesStroke, setSeriesVisible, setSeriesVisible, setSeriesVisible, setSeriesVisible, setSeriesVisibleInLegend, setSeriesVisibleInLegend, setSeriesVisibleInLegend, setSeriesVisibleInLegend, setShape, setStroke |
StackedBarRenderer3D
public StackedBarRenderer3D()
- Creates a new renderer with no tool tip generator and no URL generator.
The defaults (no tool tip or URL generators) have been chosen to
minimise the processing required to generate a default chart. If you
require tool tips or URLs, then you can easily add the required
generators.
StackedBarRenderer3D
public StackedBarRenderer3D(double xOffset,
double yOffset)
- Constructs a new renderer with the specified '3D effect'.
- Parameters:
xOffset - the x-offset for the 3D effect.yOffset - the y-offset for the 3D effect.
StackedBarRenderer3D
public StackedBarRenderer3D(boolean renderAsPercentages)
- Creates a new renderer.
- Parameters:
renderAsPercentages - a flag that controls whether the data values
are rendered as percentages.- Since:
- 1.0.2
StackedBarRenderer3D
public StackedBarRenderer3D(double xOffset,
double yOffset,
boolean renderAsPercentages)
- Constructs a new renderer with the specified '3D effect'.
- Parameters:
xOffset - the x-offset for the 3D effect.yOffset - the y-offset for the 3D effect.renderAsPercentages - a flag that controls whether the data values
are rendered as percentages.- Since:
- 1.0.2
getRenderAsPercentages
public boolean getRenderAsPercentages()
- Returns
true if the renderer displays each item value as
a percentage (so that the stacked bars add to 100%), and
false otherwise.
- Returns:
- A boolean.
- Since:
- 1.0.2
setRenderAsPercentages
public void setRenderAsPercentages(boolean asPercentages)
- Sets the flag that controls whether the renderer displays each item
value as a percentage (so that the stacked bars add to 100%), and sends
a
RendererChangeEvent to all registered listeners.
- Parameters:
asPercentages - the flag.- Since:
- 1.0.2
findRangeBounds
public Range findRangeBounds(CategoryDataset dataset)
- Returns the range of values the renderer requires to display all the
items from the specified dataset.
- Specified by:
findRangeBounds in interface CategoryItemRenderer- Overrides:
findRangeBounds in class BarRenderer
- Parameters:
dataset - the dataset (null not permitted).
- Returns:
- The range (or
null if the dataset is empty).
calculateBarWidth
protected void calculateBarWidth(CategoryPlot plot,
java.awt.geom.Rectangle2D dataArea,
int rendererIndex,
CategoryItemRendererState state)
- Calculates the bar width and stores it in the renderer state.
- Overrides:
calculateBarWidth in class BarRenderer
- Parameters:
plot - the plot.dataArea - the data area.rendererIndex - the renderer index.state - the renderer state.
createStackedValueList
protected static java.util.List createStackedValueList(CategoryDataset dataset,
java.lang.Comparable category,
double base,
boolean asPercentages)
- Deprecated. As of 1.0.13, use
createStackedValueList(
     CategoryDataset, Comparable, int[], double, boolean)
.
- Returns a list containing the stacked values for the specified series
in the given dataset, plus the supplied base value.
- Parameters:
dataset - the dataset (null not permitted).category - the category key (null not permitted).base - the base value.asPercentages - a flag that controls whether the values in the
list are converted to percentages of the total.
- Returns:
- The value list.
- Since:
- 1.0.4
createStackedValueList
protected static java.util.List createStackedValueList(CategoryDataset dataset,
                                                       java.lang.Comparable category,
                                                       int[] includedRows,
                                                       double base,
                                                       boolean asPercentages)
- Returns a list containing the stacked values for the specified series
in the given dataset, plus the supplied base value.
- Parameters:
dataset - the dataset (null not permitted).category - the category key (null not permitted).includedRows - the included rows.base - the base value.asPercentages - a flag that controls whether the values in the
list are converted to percentages of the total.
- Returns:
- The value list.
- Since:
- 1.0.13
drawItem
public void drawItem(java.awt.Graphics2D g2,
                     CategoryItemRendererState state,
                     java.awt.geom.Rectangle2D dataArea,
                     CategoryPlot plot,
                     CategoryAxis domainAxis,
                     ValueAxis rangeAxis,
                     CategoryDataset dataset,
                     int row,
                     int column,
                     int pass)
- Draws the visual representation of one data item from the chart (in
fact, this method does nothing until it reaches the last item for each
category, at which point it draws all the items for that category).
- Specified by:
drawItem in interface CategoryItemRenderer- Overrides:
drawItem in class BarRenderer3D
- Parameters:
g2 - the graphics device.state - the renderer state.dataArea - the plot area.plot - the plot.domainAxis - the domain (category) axis.rangeAxis - the range (value) axis.dataset - the data.row - the row index (zero-based).column - the column index (zero-based).pass - the pass index.
drawStackHorizontal
protected void drawStackHorizontal(java.util.List values,
                                   java.lang.Comparable category,
                                   java.awt.Graphics2D g2,
                                   CategoryItemRendererState state,
                                   java.awt.geom.Rectangle2D dataArea,
                                   CategoryPlot plot,
                                   CategoryAxis domainAxis,
                                   ValueAxis rangeAxis,
                                   CategoryDataset dataset)
- Draws a stack of bars for one category, with a horizontal orientation.
- Parameters:
values - the value list.category - the category.g2 - the graphics device.state - the state.dataArea - the data area (adjusted for the 3D effect).plot - the plot.domainAxis - the domain axis.rangeAxis - the range axis.dataset - the dataset.- Since:
- 1.0.4
drawStackVertical
protected void drawStackVertical(java.util.List values,
                                 java.lang.Comparable category,
                                 java.awt.Graphics2D g2,
                                 CategoryItemRendererState state,
                                 java.awt.geom.Rectangle2D dataArea,
                                 CategoryPlot plot,
                                 CategoryAxis domainAxis,
                                 ValueAxis rangeAxis,
                                 CategoryDataset dataset)
- Draws a stack of bars for one category, with a vertical orientation.
- Parameters:
values - the value list.category - the category.g2 - the graphics device.state - the state.dataArea - the data area (adjusted for the 3D effect).plot - the plot.domainAxis - the domain axis.rangeAxis - the range axis.dataset - the dataset.- Since:
- 1.0.4
equals
public boolean equals(java.lang.Object obj)
- Tests this renderer for equality with an arbitrary object.
- Overrides:
equals in class BarRenderer3D
- Parameters:
obj - the object (null permitted).
- Returns:
- A boolean.
Copyright © 2000-2009 by Object Refinery Limited. All Rights Reserved.