 org.jfree.chart.renderer.AbstractRenderer
org.jfree.chart.renderer.category.AbstractCategoryItemRenderer
org.jfree.chart.renderer.category.LineAndShapeRenderer
org.jfree.chart.renderer.category.LineRenderer3D
org.jfree.chart.renderer.AbstractRenderer
org.jfree.chart.renderer.category.AbstractCategoryItemRenderer
org.jfree.chart.renderer.category.LineAndShapeRenderer
org.jfree.chart.renderer.category.LineRenderer3D
|
Header
|
|||||||||
| PREV CLASS NEXT CLASS | FRAMES NO FRAMES | |||||||||
| SUMMARY: NESTED | FIELD | CONSTR | METHOD | DETAIL: FIELD | CONSTR | METHOD | |||||||||
java.lang.Object
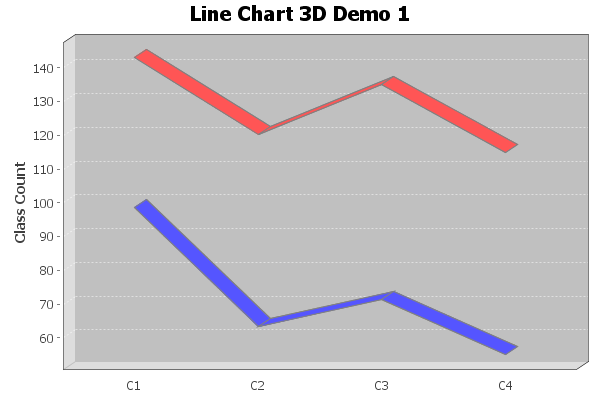
public class LineRenderer3D
A line renderer with a 3D effect. The example shown here is generated by
the LineChart3DDemo1.java program included in the JFreeChart
Demo Collection:
| Field Summary | |
|---|---|
static java.awt.Paint |
DEFAULT_WALL_PAINT
The default wall paint. |
static double |
DEFAULT_X_OFFSET
The default x-offset for the 3D effect. |
static double |
DEFAULT_Y_OFFSET
The default y-offset for the 3D effect. |
| Fields inherited from class org.jfree.chart.renderer.AbstractRenderer |
|---|
DEFAULT_OUTLINE_PAINT, DEFAULT_OUTLINE_STROKE, DEFAULT_PAINT, DEFAULT_SHAPE, DEFAULT_STROKE, DEFAULT_VALUE_LABEL_FONT, DEFAULT_VALUE_LABEL_PAINT, ZERO |
| Constructor Summary | |
|---|---|
LineRenderer3D()
Creates a new renderer. |
|
| Method Summary | |
|---|---|
void |
drawBackground(java.awt.Graphics2D g2,
                             CategoryPlot plot,
                             java.awt.geom.Rectangle2D dataArea)
Draws the background for the plot. |
void |
drawDomainGridline(java.awt.Graphics2D g2,
                                     CategoryPlot plot,
                                     java.awt.geom.Rectangle2D dataArea,
                                     double value)
Draws a grid line against the domain axis. |
void |
drawItem(java.awt.Graphics2D g2,
                 CategoryItemRendererState state,
                 java.awt.geom.Rectangle2D dataArea,
                 CategoryPlot plot,
                 CategoryAxis domainAxis,
                 ValueAxis rangeAxis,
                 CategoryDataset dataset,
                 int row,
                 int column,
                 int pass)
Draw a single data item. |
void |
drawOutline(java.awt.Graphics2D g2,
                       CategoryPlot plot,
                       java.awt.geom.Rectangle2D dataArea)
Draws the outline for the plot. |
void |
drawRangeGridline(java.awt.Graphics2D g2,
                                   CategoryPlot plot,
                                   ValueAxis axis,
                                   java.awt.geom.Rectangle2D dataArea,
                                   double value)
Draws a grid line against the range axis. |
void |
drawRangeMarker(java.awt.Graphics2D g2,
                               CategoryPlot plot,
                               ValueAxis axis,
                               Marker marker,
                               java.awt.geom.Rectangle2D dataArea)
Draws a range marker. |
boolean |
equals(java.lang.Object obj)
Checks this renderer for equality with an arbitrary object. |
java.awt.Paint |
getWallPaint()
Returns the paint used to highlight the left and bottom wall in the plot background. |
double |
getXOffset()
Returns the x-offset for the 3D effect. |
double |
getYOffset()
Returns the y-offset for the 3D effect. |
void |
setWallPaint(java.awt.Paint paint)
Sets the paint used to hightlight the left and bottom walls in the plot background, and sends a RendererChangeEvent to all
registered listeners. |
void |
setXOffset(double xOffset)
Sets the x-offset and sends a RendererChangeEvent to all
registered listeners. |
void |
setYOffset(double yOffset)
Sets the y-offset and sends a RendererChangeEvent to all
registered listeners. |
| Methods inherited from class java.lang.Object |
|---|
finalize, getClass, notify, notifyAll, toString, wait, wait, wait |
| Field Detail |
|---|
public static final double DEFAULT_X_OFFSET
public static final double DEFAULT_Y_OFFSET
public static final java.awt.Paint DEFAULT_WALL_PAINT
| Constructor Detail |
|---|
public LineRenderer3D()
| Method Detail |
|---|
public double getXOffset()
getXOffset in interface Effect3DsetXOffset(double),
getYOffset()public double getYOffset()
getYOffset in interface Effect3DsetYOffset(double),
getXOffset()public void setXOffset(double xOffset)
RendererChangeEvent to all
registered listeners.
xOffset - the x-offset.getXOffset()public void setYOffset(double yOffset)
RendererChangeEvent to all
registered listeners.
yOffset - the y-offset.getYOffset()public java.awt.Paint getWallPaint()
setWallPaint(Paint)public void setWallPaint(java.awt.Paint paint)
RendererChangeEvent to all
registered listeners.
paint - the paint (null not permitted).getWallPaint()
public void drawBackground(java.awt.Graphics2D g2,
                           CategoryPlot plot,
                           java.awt.geom.Rectangle2D dataArea)
drawBackground in interface CategoryItemRendererdrawBackground in class AbstractCategoryItemRendererg2 - the graphics device.plot - the plot.dataArea - the area inside the axes.
public void drawOutline(java.awt.Graphics2D g2,
                        CategoryPlot plot,
                        java.awt.geom.Rectangle2D dataArea)
drawOutline in interface CategoryItemRendererdrawOutline in class AbstractCategoryItemRendererg2 - the graphics device.plot - the plot.dataArea - the area inside the axes.
public void drawDomainGridline(java.awt.Graphics2D g2,
                               CategoryPlot plot,
                               java.awt.geom.Rectangle2D dataArea,
                               double value)
drawDomainGridline in interface CategoryItemRendererdrawDomainGridline in class AbstractCategoryItemRendererg2 - the graphics device.plot - the plot.dataArea - the area for plotting data (not yet adjusted for any
3D effect).value - the Java2D value at which the grid line should be drawn.AbstractCategoryItemRenderer.drawRangeGridline(Graphics2D, CategoryPlot, ValueAxis,
Rectangle2D, double)
public void drawRangeGridline(java.awt.Graphics2D g2,
                              CategoryPlot plot,
                              ValueAxis axis,
                              java.awt.geom.Rectangle2D dataArea,
                              double value)
drawRangeGridline in interface CategoryItemRendererdrawRangeGridline in class AbstractCategoryItemRendererg2 - the graphics device.plot - the plot.axis - the value axis.dataArea - the area for plotting data (not yet adjusted for any
3D effect).value - the value at which the grid line should be drawn.AbstractCategoryItemRenderer.drawDomainGridline(Graphics2D, CategoryPlot, Rectangle2D, double)
public void drawRangeMarker(java.awt.Graphics2D g2,
                            CategoryPlot plot,
                            ValueAxis axis,
                            Marker marker,
                            java.awt.geom.Rectangle2D dataArea)
drawRangeMarker in interface CategoryItemRendererdrawRangeMarker in class AbstractCategoryItemRendererg2 - the graphics device.plot - the plot.axis - the value axis.marker - the marker.dataArea - the area for plotting data (not including 3D effect).AbstractCategoryItemRenderer.drawDomainMarker(Graphics2D, CategoryPlot, CategoryAxis,
CategoryMarker, Rectangle2D)
public void drawItem(java.awt.Graphics2D g2,
                     CategoryItemRendererState state,
                     java.awt.geom.Rectangle2D dataArea,
                     CategoryPlot plot,
                     CategoryAxis domainAxis,
                     ValueAxis rangeAxis,
                     CategoryDataset dataset,
                     int row,
                     int column,
                     int pass)
drawItem in interface CategoryItemRendererdrawItem in class LineAndShapeRendererg2 - the graphics device.state - the renderer state.dataArea - the area in which the data is drawn.plot - the plot.domainAxis - the domain axis.rangeAxis - the range axis.dataset - the dataset.row - the row index (zero-based).column - the column index (zero-based).pass - the pass index.public boolean equals(java.lang.Object obj)
equals in class LineAndShapeRendererobj - the object (null permitted).
|
Footer
|
|||||||||
| PREV CLASS NEXT CLASS | FRAMES NO FRAMES | |||||||||
| SUMMARY: NESTED | FIELD | CONSTR | METHOD | DETAIL: FIELD | CONSTR | METHOD | |||||||||