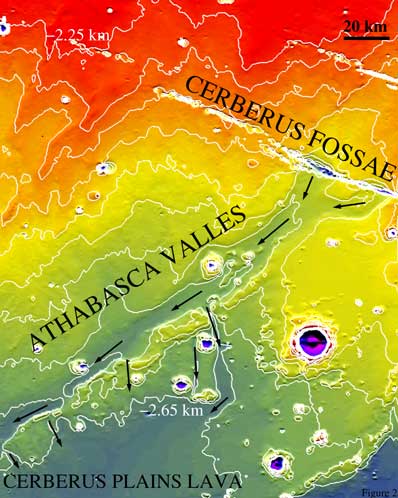
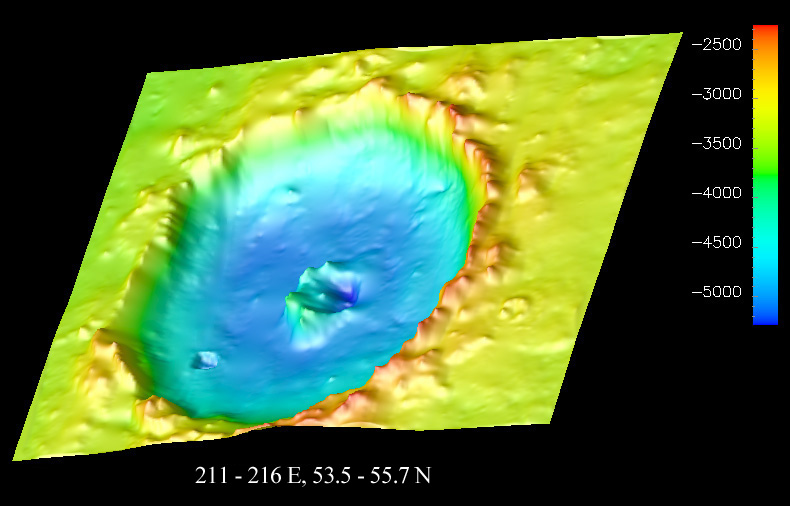
Natural neighbor interpolation of MOLA data
These color-coded, relief-shaded maps are two examples of the natural neighbor interpolation
algorithm applied to the Mars Orbiter Laser Altimeter (MOLA) data. The map on the left appeared
in a recent paper by Burr et al. (2002)1, and has a resolution of 200 pixels / degree. The digital
elevation model for Milankovic crater (right) has a resolution of 100 pixels/degree.
Foreword
Thank you for visiting! In the summer of 2001 I did a project to evaluate the usefulness of several gridding methods for MOLA data interpolation. The basic premise of the work
was to simulate MOLA data acquisition from a known digital elevation model (DEM), interpolate that data, and then quantitatively and
qualitatively compare the interpolated
surface to the original surface. The results indicated that natural neighbor method works better than other methods tested both in terms of accuracy and realistic surface appearance.
My work
Quick links
1. Natgrid, a natural neighbor package. It's part of the ngmath C/Fortran library, and can be obtained by downloading NCAR Graphics.
2. C and Fortran programs to feed the data to Natgrid functions. These programs, however, assume that the data minimum is 0 and the data maximum is 1. To address this problem, I have written custom programs natgrid_linear.c and natgrid_nonlinear.c, which can generate an arbitrary output grid.
3. A quick graphical introduction to the natural neighbor interpolation method.
4. A more mathematical discussion of natural neighbor interpolation.
1Burr, D. M., A. S. McEwen, and S. E. H. Sakimoto, Recent aqueous floods from the Cerberus Fossae, Mars, Geophys. Res. Lett., 29(1), 10.1029/2001GL013345, 2002.