This is by far the most complicated option in GMT, but most examples
of its usage are actually quite simple.
Given as -Bxinfo[/yinfo][:."title string":][W![]() w][E
w][E![]() e][S
e][S![]() s][N
s][N![]() n],
this switch specifies a map boundary to be plotted by using the
selected tick-mark intervals. xinfo and yinfo are of the form
n],
this switch specifies a map boundary to be plotted by using the
selected tick-mark intervals. xinfo and yinfo are of the form
[a]tick[m![]() c][ftick[m
c][ftick[m![]() c]][gtick[m
c]][gtick[m![]() c]][l
c]][l![]() p][:"axis label":][:,"unit label":]
p][:"axis label":][:,"unit label":]
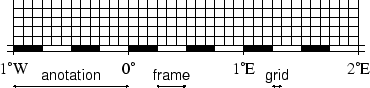
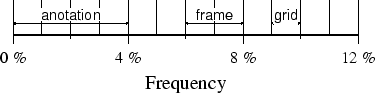
where a, f, and g stand for annotation, frame, and grid interval.
The m![]() c indicates minutes (m) or seconds (c). By
default, all 4 boundaries are plotted (denoted W, E, S,
N). To change this selection, append the codes for those you want
(e.g., WSn). Upper case (e.g., W) will annotate in addition to
draw axis/tick-marks. The title, if given, will appear centered above the plot1.1.
c indicates minutes (m) or seconds (c). By
default, all 4 boundaries are plotted (denoted W, E, S,
N). To change this selection, append the codes for those you want
(e.g., WSn). Upper case (e.g., W) will annotate in addition to
draw axis/tick-marks. The title, if given, will appear centered above the plot1.1.
 |
 |