In many applications the data is better described in polar or
cylindrical (![]() , r) coordinates rather than
the usual Cartesian coordinates (x, y). The
relationship between the Cartesian and polar coordinates are
described by
, r) coordinates rather than
the usual Cartesian coordinates (x, y). The
relationship between the Cartesian and polar coordinates are
described by
![]() .
The polar transformation is simply defined by providing
.
The polar transformation is simply defined by providing
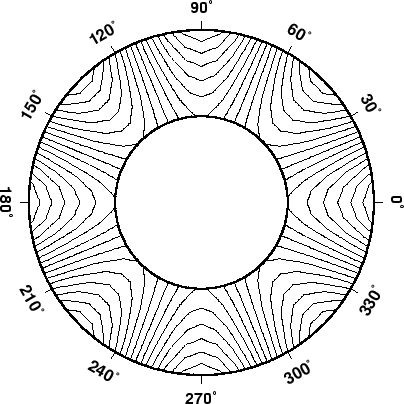
As an example of this projection we will create a gridded data set
in polar coordinates
![]() using grdmath, a RPN calculator that operates on or
creates grdfiles.
using grdmath, a RPN calculator that operates on or
creates grdfiles.
#!/bin/sh
#    $Id: GMT_polar.sh,v 1.1 2001/03/21 04:10:21 pwessel Exp $
#

grdmath -R0/360/2/4 -I6/0.1 X 4 MUL PI MUL 180 DIV COS Y 2 POW MUL = test.grd
grdcontour test.grd -JP3i -B30Ns -P -C2 -S4 > GMT_polar.ps
We used grdcontour to make a contour map of this data. Because
the data file only contains values with
![]() , a donut
shaped plot appears in Figure 5.5.
, a donut
shaped plot appears in Figure 5.5.