Use this submenu to determine the type of the active image or to convert it to another type.
An attempt to perform an unsupported conversion causes a dialog box to be displayed that lists the possible conversions. The * indicates that both single images and stacks can be converted.8-bit
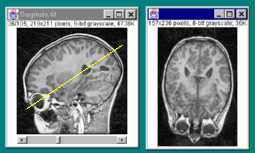
Converts to 8-bit grayscale. The active image must be 16-bit grayscale, 32-bit grayscale, 8-bit color or RGB color.ImageJ converts 16-bit and 32-bit images to 8-bits by linearly scaling from min-max to 0-255, where min and max are the two values displayed in the Image/Adjust/Brightness/Contrast tool. Image/Show Info displays these two values as the "Display range". Note that this scaling is not done if "Scale When Converting" is not checked in Edit/Options/Miscellaneous. With stacks, all the slices are scaled to 8-bits using the min and max of the currently displayed slice.
16-bit
Converts to unsigned 16-bit grayscale. The active image must be 8-bit grayscale or 32-bit grayscale.32-bit
Converts to signed 32-bit floating-point grayscale. The active image must be 8-bit grayscale or 16-bit grayscale.8-bit Color
Converts to 8-bit indexed color using Heckbert's median-cut color quantization algorithm. A dialog box allows the number of colors (2-256) to be specified. The active image must be RGB color.RGB Color
Converts to 32-bit RGB color. The active image must be grayscale, 8-bit Color, or an RGB (red, green, blue) or HSB (hue, saturation and brightness) stack.RGB Stack
Converts to a 3-slice (red, green, blue) stack. The active image must be RGB color.HSB Stack
Converts to a 3-slice (hue, saturation and brightness) stack. The active image must be RGB color.
Adjust> Brightness/Contrast...
The line graph at the top of the window shows how pixel values in the image are mapped to corresponding display values.
The two numbers under the plot are the minimum and maximum displayed pixel values. Click on Auto, and ImageJ will
automatically optimizes brightness and contrast based on an analysis of the image's histogram. Create a selection, and
the entire image will be optimized based on an analysis of the selection. Click on Reset to restore the original
brightness and contrast settings. Click on Hist to display a histogram of the image. Click on Apply to
apply the lookup table function to the pixel data (8-bit images only). Click on Thresh to thresold the image. Use
the Brightness slider to adjust the threshold.
Threshold...
The Auto button automatically sets the threshold levels based on an analysis of the histogram of the current
image or selection. Apply sets thresholded pixels to black and all other pixels to white. Reset disables
thresholding and update the histogram. B&W switches to a mode where features are displayed in black and
background in white. Click on Set (not shown) to enter new threshold levels into a dialog box.
Size...
Check Constrain Aspect Ratio to create an image with the specified width and have ImageJ adjust the height to
maintain the original aspect ratio. Check Interpolate to use bilinear interpolation. Set New width to 0
to create an image with the specified height and have ImageJ adjust the width to maintain the original aspect ratio.
Show Info...
Stacks> Add Slice Delete Slice Next Slice Previous Slice Convert Images to Stack Convert Stack to Images Convert Stack to RGB Make Montage Reslice...
Images are created by sampling each slice in the stack along the line. Thus, the first pixel in each row of the output
image is taken from the start of the line and the last from the end. In the case where Slice Width is greater than
one, a stack is created by shifting the line down and to the left to generate additional slices for the output stack.
This plugin, and the ZProject plugin, were contributed by
Patrick Kelly and Harvey Karten of the
University of California, San Diego.
ZProject... 3D Project...
This routine was written by Michael Castle and Janice Keller of the University of Michigan Mental Health Research
Institute (MHRI).
Select Nearest Point projection to produce an image of the surfaces visible from the current viewing angle. At
each point in the projection plane, a ray passes normal to the plane through the volume. The value of the nearest non
transparent point which the ray encounters is stored in the projection image. Brightest Point projection examines
points along the rays, projecting the brightest point encountered along each ray. This will display the brightest
objects, such as bone in a CT (computed tomographic) study. Mean Value projection, a modification of
brightest-point projection, sums the values of all transparent points along each ray and projects their mean value. It
produces images with softer edges and lower contrast, but can be useful when attempting to visualize objects contained
within a structure of greater brightness (e.g. a skull).
Slice Interval is the interval, in pixels, between the slices that make up the volume. ImageJ projects the volume
onto the viewing plane at each Rotation Angle Increment, beginning with the volume rotated by Initial
Angle and ending once the volume has been rotated by Total Rotation.
The Lower and Upper Transparency Bound parameters determine the transparency of structures in the volume.
Projection calculations disregard points having values less than the lower threshold or greater than the upper
threshold. Setting these thresholds permits making background points (those not belonging to any structure) invisible.
By setting appropriate thresholds, you can strip away layers having reasonably uniform and unique intensity values and
highlight (or make invisible) inner structures. Note that you can also use Image/Adjust/Thresold to set the
transparency bounds.
Sometimes, the location of structures with respect to other structures in a volume is not clear. The Surface
Opacity parameter permits the display of weighted combinations of nearest-point projection with either of the other
two methods, often giving the observer the ability to view inner structures through translucent outer surfaces. To
enable this feature, set Surface Opacity to a value greater than zero and select either Mean Value or
Brightest Point projection.
Depth cues can contribute to the three-dimensional quality of projection images by giving perspective to projected
structures. The depth-cueing parameters determine whether projected points originating near the viewer appear brighter,
while points further away are dimmed linearly with distance. The trade-off for this increased realism is that data
points shown in a depth-cued image no longer possess accurate densitometric values. Two kinds of depth-cueing are
available: Surface Depth-Cueing and Interior Depth-Cueing. Surface Depth-Cueing works only on
nearest-point projections and the nearest-point component of other projections with opacity turned on. Interior
Depth-Cueing works only on brightest-point projections. For both kinds, depth-cueing is turned off when set to zero
(i.e. 100% of intensity in back to 100% of intensity in front) and is on when set at 0<n 100 (i.e. (100-n)% of
intensity in back to 100% intensity in front). Having independent depth-cueing for surface (nearest-point) and interior
(brightest-point) allows for more visualization possibilities.
Plot Z-axis Profile Start Animation Stop Animation Animation Options... Crop Duplicate Scale...
Rotate> Flip Vertical Flip Horizontal Rotate 90 Degrees Right Rotate 90 Degrees Left Arbitrarily...
Lookup Tables> Colors...
This submenu contains commands that
adjust brightness/contrast, threshold levels and image size.
Use this tool to alter the brightness and contrast of the active image. With 8-bit images, brightness and contrast are
changed by updating the image's look-up table (LUT), so pixel values are unchanged. With 16-bit images, the display is
updated dynamically by changed how the 16-bit values are mapped to 8-bits, and the 16-bit pixel values are unchanged.
32-bit (float) images are handled the same way as 16-bit images. Brightness and contrast of RGB images are changed by
modifying the pixel values.
Use this tool to interactively set lower and upper threshold values, segmenting the image into features of interest and
background. Pixels with brightness values greater than or equal to the lower threshold and less than or equal to the
upper threshold are displayed in red. Use Analyze/Measure (with "Limit to Threshold" in Analyze/Measurement
Options checked) to measure the aggregate of the selected features. Use Analyze/Analyze Particles to measure
features individually. Use the wand tool to outline a single feature.
Scales the active image or selection to a
specified width and height in pixels.
Opens a text window containing
information about the active image. For DICOM and FITS images, also displays file header information. Use the popup menu
(right-click in the Info window) to save the information to a text file or copy it to the system clipboard.
This submenu contains commands that work
with stacks.
Inserts a blank
slice after the currently displayed slice. Hold down the alt key to add the slice before the current slice.
Deletes the currently displayed slice.
Displays the slice that follows the
currently displayed slice. As a shortcut, press the ">" key.
Displays the slice that precedes the
currently displayed slice. As a shortcut, press the "<" key.
Creates a new stack
consisting of all images currently displayed in separate windows. The
images must all be the same type and size.
Converts the slices in the
current stack to separate image windows.
Converts a 2 or 3-slice stack
to an RGB image. The stack must be 8-bit or 16-bit grayscale.
Produces a single image which contains
the images from a stack displayed in a grid format. This can be useful for visual comparisons of a series of images
stored in a stack. A dialog box allows you to specify the magnification level at which the images are copied, and to
select the layout of the resulting grid.
Reconstructs one or more orthogonal slices through the image volume represented by the current stack. Before using this
command, create a straight line or rectangular selection to specify were the reconstructions will be done. A dialog box
allows you the specify the Z-Spacing (displacement between slices) of the source volume. Multiple slices are
reconstructed and saved as a stack if you create a rectangular selection or set Slice Width greater than one.
Projects an image stack along the axis perpendicular to image plane (the so-called "z" axis). Four different projection
types are supported. Average Intensity projection outputs an image wherein each pixel stores average intensity
over all images in stack at corresponding pixel location. Maximum Intensity projection creates an output image
each of whose pixels contains the maximum value over all images in the stack at the particular pixel location. Sum
Slices creates a real image that is is sum of the slices in the stack. Standard Deviation creates a real
image containing the standard deviation of the slices.
Generates an animation sequence by projecting through a rotating 3D data set onto a plane. Each frame in the animation
sequence is the result of projecting from a different viewing angle. To visualize this, imagine a field of parallel rays
passing through a volume containing one or more solid objects and striking a screen oriented normal to the directions of
the rays. Each ray projects a value onto the screen, or projection plane, based on the values of points along its path.
Three methods are available for calculating the projections onto this plane: nearest-point, brightest-point, and
mean-value. The choice of projection method and the settings of various visualization parameters determine how both
surface and interior structures will appear.
Plots the ROI selection mean gray value versus slice number. Requires a selection.
Animates the active stack by
repeatedly displaying its slices (frames) in sequence. Use Stop Animation, or click with the mouse, to stop. Use
the Animation Options dialog box to specify the animation speed. More than one stack can be animated at a time.
As a shortcut, press the "=" key to start animation.
Terminates animation of the active
stack.
Use this dialog to set the
animation speed in frames per second or to enable "oscillating" animation.
Crops the image or stack based on the current
rectangular selection.
Creates a new window containing a copy of
the active image or rectangular selection. Hold the alt key down to skip the dialog box.
Resizes the image or selection horizontally
and/or vertically by scale factors entered into a dialog box. Check Interpolate to scale using bilinear
interpolation. Use integer scale factors (2, 3, 5, etc.) for the best looking results, particularly with graphics and
text. With scale factors less then 1.0, smoothing the source image prior to scaling may produce better looking results.
This submenu contains commands that
rotate the active image or stack.
Turns the image or
selection upside down.
Replaces the image or selection with
a mirror image of the original.
Rotates the entire image or
stack clockwise 90 degrees.
Rotates the entire image or
stack counter-clockwise 90 degrees.
Use this dialog to rotate the active
image or selection clockwise the specified number of degrees. Check Interpolate to use bilinear interpolation.
This submenu contains a selection
of color lookup tables that can be applied to grayscale images to produce false-color images. If no image is open, a
256x32 ramp image is created to display the color table.
Displays an image that can be clicked on
to change the foreground color used by the Edit/Draw and Edit/Fill commands. To change the background
color, click with the alt key down. Unlike ordinary windows, colors can be "picked up" from the "Colors" window without
switching to the dropper tool.